Introduction
We are working at QIMA, a company working in quality control and supply chain audit. We are currently building an awesome application called QIMAone.
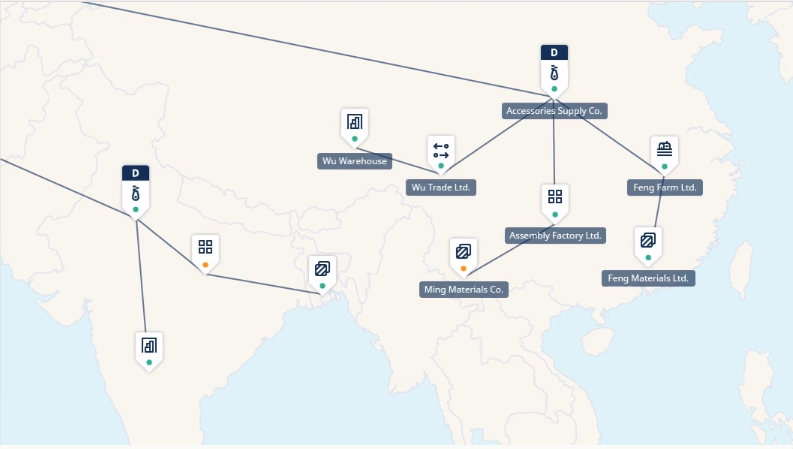
One of the features that the team has to perform is giving to a brand a global and nice view of it networks.
We would like to represent the location of each supplier by the presence of a pin adequately located on the map.
First we had to find a solution to embed maps which:
- Has to be supported every country
- Has to be loaded fast
- Has to be customisable
After some research 🔎 , we choosed MapKit JS! 👏
MapKitJS is an API that makes it easy to embed interactive maps directly into your webpages or apps across different platforms and operating systems, including iOS and Android.
After a smooth start with the library, we finally encountered some difficulties. Indeed if the tool is easy to learn, we are however missing some possibilities in it:
- To compute the collision clusters and the link between them
- To define the best level of zoom regarding to the cluster's location.
- To optimize the number of pin that we can see initially when we load the map

a Cluster is a division of the population or data points into groups
First we wanted to display all suppliers on a map, group them by cluster and link them with lines when they are working together.
Unfortunately when we let MapKit manage the clusters, there is no way to know if a pin is hidden (grouped in a cluster) or not at a given time. And so we don’t know whether we should draw the line to the coordinates of the pin or to the coordinates of the cluster.
After that we had some concerns regarding the management of the zoom level in order to display the maximum pin on the screen.
Then we had to work to optimize the position of the rectangle representing what we see currently on the map. That will be our focus in this article.
We looked at how we could fix these problems ourselves.
We ended up by writing some custom algorithms 💪
Displaying as many annotations as possible
To be able to display a maximum of notation on the screen, we must start by retrieving their exact position.
Unfortunately when we tried to find the position on lots of annotations that are too far away to fit on the screen because of the minimum zoom level, MapKitJS just displays the middle of the group of annotations. As we knew that cases where displaying all pins on the map at once would be frequent, we wanted to find a way to display as many pins as possible while ensuring that a specific “main” pin was always shown by default. Here is how we did it.
First we need to know the size of the largest rectangle that we can display on the map. The simplest way to find this information is to look to the size of the visible region when the map has just loaded. Since MapKitJS initializes the map with the minimum zoom level by default, we know that the initial visible region correspond to this maximum span.
Once we have the size of the largest region we can display, we can call the following function to compute the largest set of annotation that fits within this rectangle while making sure that a specific “anchor” annotation is always part of this group.
public optimalAnnotationGroup(annotations: mapkit.Annotation[], anchor: mapkit.Annotation, size: mapkit.MapSize): mapkit.Annotation[] {
    const includeZero = Boolean(anchor);
    const anchorMapPoint = includeZero ? anchor.coordinate.toMapPoint() : this.createMapPoint(0, 0);
    const items = [];
    // Add anchor to the list of points if provided
    for (const annotation of includeZero ? [anchor, ...annotations] : annotations) {
      const mapPoint = annotation.coordinate.toMapPoint();
      const x = mapPoint.x - anchorMapPoint.x;
      const y = mapPoint.y - anchorMapPoint.y;
      items.push({ x, y, annotation });
      // We add this additionnal item to virtually unwrap all items around the globe
      items.push({ x: x < 0 ? x + 1 : x - 1, y, annotation });
    }

const sortedX = items.sort((a, b) => a.x - b.x);annotations: List of annotations available on the map
anchor: Main pin which must be displayed
size: Size of the rectangle visible on the map
We begin to set annotation and anchor in a list “items” order by the x-axis.
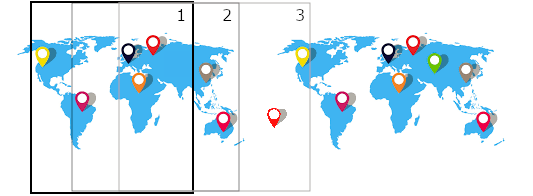
In the example below, we have our anchor in San Francisco and our rectangle that only moves east. In our situation we cannot take into account the pines west of our anchor (for example below the red pine). To solve this problem we have chosen to duplicate the map and the pin. With this solution we can find the rectangle "3" which contains the most pine.
    const sortedX = items.sort((a, b) => a.x - b.x);
    let startX = 0;
    let endX = -1;
    let bestSubset = [];
    // First we slide an horizontal window of length size.width by
    // incrementing the index of the first element (startX) and updating the
    // index of the last element (endX) accordingly.
    // If the window does not contain 0 when required then we can also stop.
    while (endX + 1 < sortedX.length && (!includeZero || sortedX[startX].x <= 0)) {
      // Make sure that the index endX of the last item is the best possible given startX and size.width
      while (endX + 1 < sortedX.length && sortedX[endX + 1].x - sortedX[startX].x <= size.width) {
        endX++;
      }
      // If our horizontal window contains more points than the best subset then
      // we have a chance to find a better subset of points. We also make sure that 0 is included when required.
      // In that case we repeat the same window sliding technique on the x-selected points along the y axis.
      if (endX - startX + 1 > bestSubset.length && (!includeZero || sortedX[endX].x >= 0)) {
        const sortedY = sortedX.slice(startX, endX + 1).sort((a, b) => a.y - b.y);
        let startY = 0;
        let endY = -1;
        while (endY + 1 < sortedY.length && (!includeZero || sortedY[startY].y <= 0)) {
          while (endY + 1 < sortedY.length && sortedY[endY + 1].y - sortedY[startY].y <= size.height) {
            endY++;
          }
          // Here we finally check if the current x/y selection gives us a better subset
          if (endY - startY + 1 > bestSubset.length && (!includeZero || sortedY[endY].y >= 0)) {
            bestSubset = sortedY.slice(startY, endY + 1);
          }
          startY++;
        }
      }
      startX++;
    }

    return bestSubset.map(a => a.annotation);
  }
StartX: the index of the annotation the most in the left side of our rectangle
EndX: the index of the annotation the most in the right side of our rectangle
Here we set our rectangle on the pin with the smallest X-axis. We ignore the y-axis by considering only the x-axis of the annotations.
We will first start by taking to the first element of our array (which is the anchor) startx. We will then increment endX to find the index of the most right annotation possible while staying in the rectangle containing our origin.
Then we do the same on the y-axis. We now have our first rectangle with the “bestSubset” array containing the annotations present. We will now iterate on the ordinates to find the best rectangle.
Finally we are going to move our rectangle on the x-axis and then on the y-axis in order to find the best possible rectangle.
There are, however, a few subtleties:
- Each annotation is present twice in the start list. However, we want to display only one. For this we limit the size of the rectangle to 1 (our coordinates are between 0 and 1).
- Before iterating on the y-axis, we check that the column contains at least as many annotations as “bestSubset” (the array containing the maximum annotation so far).
If you are interested to read more about this topic, you can read this related article
We are currently hiring more Front-End developers!, Join us! ✨
Written by POQUET Charles, Front-End developer at QIMA. ✍️